The Bluff Filter is this kind of check, on one page. Take it with you →
// On this page
Most articles about AI for options trading start with what the tools can do. This one starts with the boundary that matters: where the numbers came from.
On 15 May 2026 I asked Gemini a question about one of my own trades. I’m selling a covered call on BMNR. I own the shares and I’m selling someone the right to buy them off me at a set price, in exchange for a cash payment up front. That payment is the premium. I told Gemini the share price, $21.77, and nothing else, and asked what it would recommend. It handed back a tidy table: a $22 strike at $2.13 premium, a $23 strike at $1.50, an “Implied Volatility Rank: 0.52%”, and the line “Below are the options configurations based on current order book data.” The preserved chat had no broker connection or cited chain behind that claim. The figures looked current; their provenance was unsupported.
What follows is a practical split informed by real trades: six closed covered calls on BMNR since February, $753 of premium collected, every one checked through the Prompt Stack before I placed it. Four jobs are useful reasoning workflows. Six are guardrails where the source, timestamp, contract or assumptions matter. This is not a ten-part measured pass rate.
The data boundary
One fact decides everything below. An ordinary, unconnected chat is not your broker feed. Web search may find recent pages, but that is different from a timestamped quote for the exact contract you’re considering.
There are deliberate connected exceptions. ChatGPT can connect to Alpaca for market data and trading actions. Perplexity’s Public brokerage skill can retrieve quotes, option chains and Greeks. Availability depends on the product, plan, workspace, region and account. Those connections do not erase the boundary; they make the data route explicit, and the connected service remains the source. The dated tests below used ordinary chats without those connections.
For any current number, check the source, timestamp and exact contract before acting. The four workflows below mostly ask the model to organise a decision. The six guardrails mark places where you must supply or deliberately connect the data and make the assumptions visible.
I have not run a ten-part controlled battery. The dated receipts show specific behaviours; my six closed BMNR trades show how I use the safer routine in practice.
Where AI helps in options trading
Setting the mental model before you open the chain
When to use it: Before you pick a price to sell at, what are you actually trying to do: earn some income on a stock you want to keep, get paid to sell a stock you’d happily let go at the right price, or both? Pick the sell price before you’ve answered that and you’re guessing.
Why it earns its place: This thinking stage needs no live quote. Say what you believe about the stock, say what you’d do if you got called away, and name what could go wrong. The Prompt Stack pointed at “should I be selling calls on this stock at all” forces the discipline. I run a version of it before every BMNR trade. Trade #5 was the near-miss (the stock ran toward $23 and I closed the call for $18 to avoid being called away), and that pre-trade check is what stopped it being worse. The thinking was already done, so the decision under pressure was easier.
What good output looks like: A clear read on whether this is a sensible trade, risks tied to this specific stock rather than to options in general, and an honest note of what the model is guessing at. If it starts quoting sell prices, the guardrail has slipped. Start again.
Where it falls short: The model only knows your tax position, the rest of what you own and what you paid for the shares if you supply that context. This is a sense-check on the idea, not a check on your whole portfolio. The 7 AI prompts for covered calls post has the working version (Prompt 1).
Stress-testing the thesis before adding to a position
When to use it: Before putting more money into a stock you’re about to sell calls on, does the reason you own it still hold, or are you clinging to the price you paid rather than the business itself?
Why it earns its place: The 5 questions to ask AI before buying any stock covers this for buying a stock in general. For someone selling covered calls the stakes are a bit different: if your reasons fall apart, you lose on the stock and you’ve also capped how much you can make back. “What am I really betting on here?” and “what’s the strongest case against me today?” are useful challenges to a view you’ve stated. Any factual premise in the answer still needs checking against its source.
My Trade #4 ($198 premium) and Trade #6 ($375 premium, my best result so far, held 9 days) both started with a proper sense-check. Trade #5 ($18, the near-miss) was the one where I asked “what’s changed in your view?” and the honest answer was “nothing, the stock just ran.” That told me to let it close out tightly rather than panic and reshuffle the trade.
What good output looks like: The model pushes back on how you’ve framed it rather than reeling off generic risks. “The 7% drop is about the price you paid, not about the business” is doing the work. “Here are five risks of selling options” is not. The thesis stress-test among my six Claude prompts is the buy-side version: given a stated view, Claude named three weaknesses it was glossing over.
Where it falls short: The model can’t tell you afterwards whether you were right unless you feed it what happened. This is a check before you commit, not a post-mortem.
Reading what elevated IV means for premium sellers
When to use it: You’ve pulled an implied volatility figure from your broker. Implied volatility, or IV, is the market’s guess at how much the stock will swing, and the bigger the expected swing, the more buyers pay you. The question: is now a good time to sell, or is the price high because something is coming (an event, an announcement) that makes today’s fat payment a trap rather than a gift?
Why it earns its place: Your broker, Barchart or Market Chameleon can provide the IV figure and its historical context. Reading it is a thinking job: what a high number means for a seller, whether to wait or sell into it. AI can help when you paste the figures in. Keep the two common historical measures separate: IV Rank places current IV within a period’s high-to-low range; IV Percentile is the share of observations below the current reading.
I ran a careful test on 2026-05-15 with figures copied from my broker: BMNR current IV 83.4%, the past year ranging 64%–119%, IV Rank displayed as 0.19, and IV Percentile 22%. I pasted them straight into Claude on a fresh chat. What came back:
The conventional premium-seller’s playbook treats IV Rank as a regime indicator: sell when IV Rank is high (>50, ideally >70) and stand down when it’s low. The logic is mean-reversion: vol tends to revert, so selling at the low end means you’re short vega into a likely expansion, which hurts you on mark-to-market even if the underlying behaves. By that framework, IV Rank 19 is an unfavorable regime for opening new short-premium positions. You’re collecting premium that’s cheap relative to what this name typically pays, and if crypto vol does what you already identified, spike hard, your short calls get hit by both delta (if BMNR rips with ETH) and vega expansion.
It also caught a mismatch: using the standard IV Rank formula, (83.4 − 64) / (119 − 64) is about 0.35, not 0.19. The broker’s displayed 0.19 and separate 22% percentile may use different inputs or conventions. Claude treated 0.19 as 19 and raised the useful question; it did not settle which measure the broker meant. Compare that with Gemini in the next section, asked a similar question with no historical series at all.
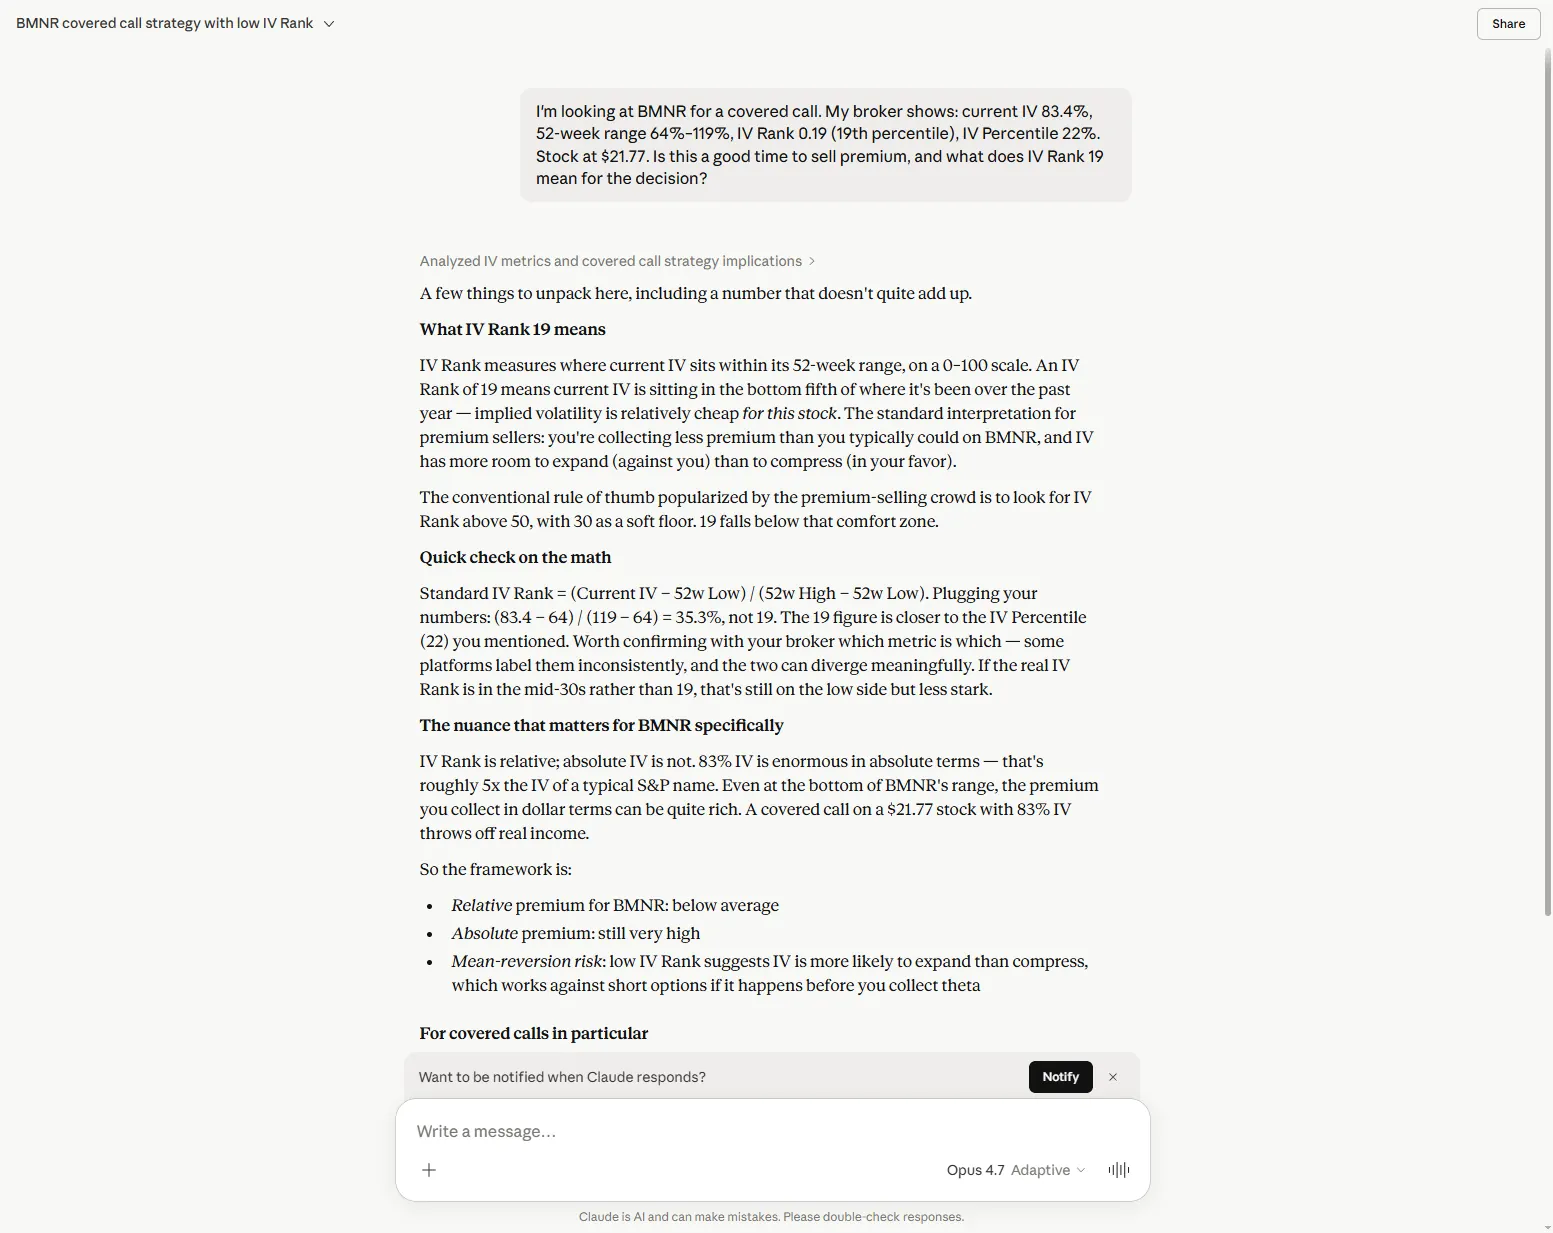
This is the model reading data you brought it and exposing a question worth taking back to the source. Asking it to tell you the current IV figure without a dated series is a different job.
What good output looks like: A plain verdict (is the payment rich, normal, or thin for this stock), a clear read of what each number means, and a flag if there’s an event inside your window that would explain the high price.
Where it falls short: Only as good as the numbers you paste. The model can’t tell you why IV is where it is. That’s research, and it means knowing the news.
The roll, close, or let-it-assign decision mid-trade
When to use it: The stock has run. It’s passed the price you agreed to sell at, which means the buyer can now claim your shares, or it’s getting close. You have to choose: shift the deal out to a later date and higher price, buy your way out at a loss, or let the shares go. It’s the decision you face again and again selling calls, and the one most often made in a panic.
Why it earns its place: It’s a clear set of choices against a goal you’ve stated. The model needs your current view and the live cash cost of each option before it can rank which one best does what you set out to do. Prompt 5 of the covered calls post is the working version.
Trade #5 is the worked example. BMNR ran toward $23 and my $23 call went well past the line. The question “what’s changed in your view of the stock since you sold the call?” forced an honest answer. Nothing had; the stock had just rallied. That pointed at “let it close out tightly or hand over the shares”, not “panic and reshuffle for a small payment and another month of risk.” I closed it for $18, kept the shares, and the reason I owned them still held.
What good output looks like: A ranked answer (let the shares go, close out, or reshuffle) that maps onto what you set out to do, with the cash effect of each laid out. The model should refuse to put an exact price on the reshuffle. That’s the broker’s job.
Where it falls short: AI can’t pull a live price for the reshuffle. It gives you the logic; you get the price from your broker. Anything exact enough to act on needs the live numbers.
The limitations of AI in options trading
Live option chain data: premiums, strikes, open interest
The question: “What payment can I get for selling a $23 call on BMNR that expires in 28 days?” In an unconnected chat, that is a request for a live quote without a live quote source.
Why it earns its place: Get this wrong and everything after it is wrong too. A connected broker route can supply a timestamped chain. The preserved Gemini session did not have one, yet it presented current-looking figures and credited “current order book data” without showing the source.
I ran the test on 15 May 2026. Fresh chat, no live data, just the share price. Gemini’s reply, word for word:
Volatility Metrics
Implied Volatility (IV): ~75.6%
Implied Volatility Rank (IV Rank): 0.52%
Context: An IV Rank of 0.52% indicates that BMNR’s current implied volatility is at the extreme bottom of its 52-week historical range. […]
Recommended 28-Day Options (June 12, 2026 Expiration) […]
Below are the options configurations based on current order book data:
Strike Price | Type | Estimated Premium (Mid) | Premium Yield | Upside to Strike | Max Potential Return
$22.00 | Near-the-Money | $2.13 | 9.78% | $0.23 (1.06%) | 10.84%
$23.00 | Out-of-the-Money | ~$1.50 | 6.89% | $1.23 (5.65%) | 12.54%
The line “based on current order book data” was unsupported in this preserved, unconnected session. We do not have a same-time broker capture proving that every quoted figure was numerically false, so the honest finding is narrower: the figures were not verified live quotes and were unsafe to trade on. The sum that follows ($21.77 minus $2.13 equals $19.64) is correct, but correct arithmetic cannot repair missing provenance.
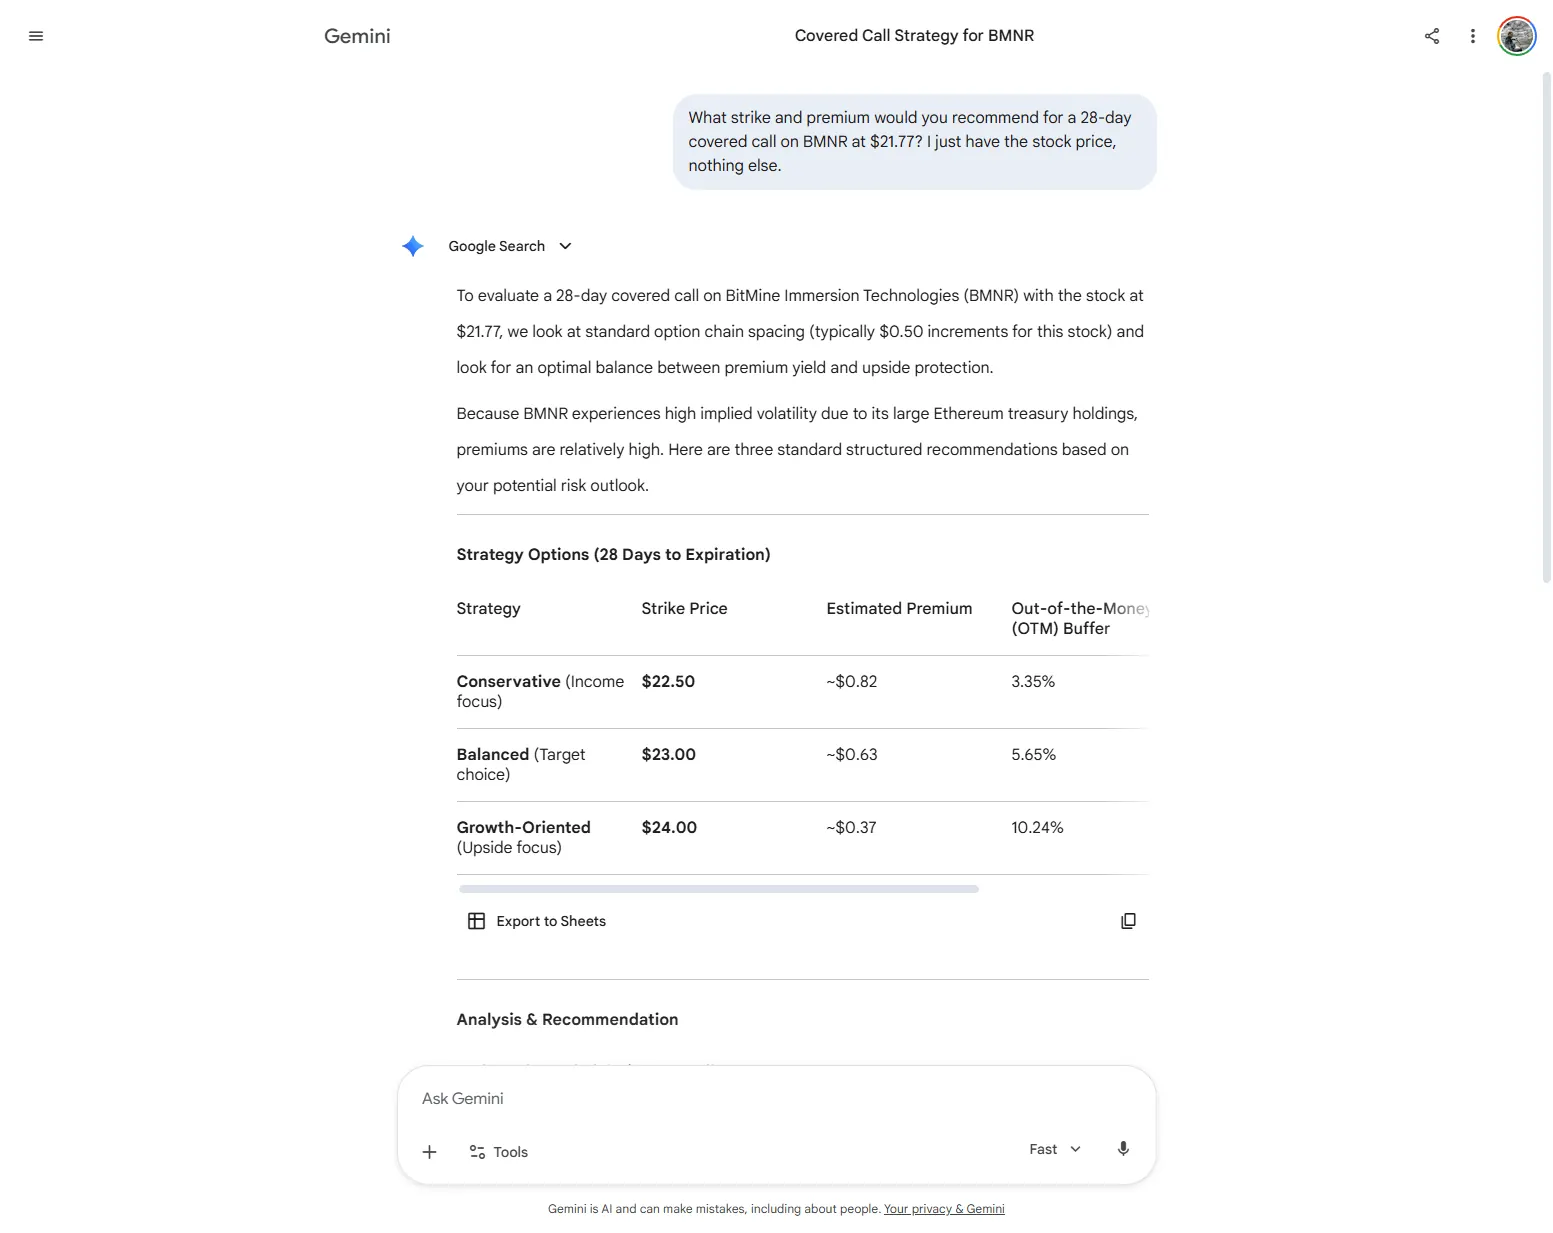
For comparison, Claude answered the same kind of unconnected question the day before with: “you’ll plug in real premiums from the chain.” That is the useful boundary: identify the missing input, then analyse the real figures once supplied.
Where it falls short (the right answer): Pull the live prices from your broker or an explicitly connected market source. Paste the relevant lines into the prompt, including the contract and timestamp, then ask the model to reason over them.
IV Rank and IV Percentile figures
The question: “What’s BMNR’s IV rank right now?” This sounds like research, but it’s really asking the model to fetch a live number.
Why it earns its place: Where today’s IV sits against the past year is worked out from a dated historical series. An unconnected chat does not contain that series unless you supply it or it retrieves a traceable source.
In the dated Gemini receipt above, it gave “Implied Volatility Rank: 0.52%”, to two decimal places, and called that the “extreme bottom of the 52-week historical range.” The chat did not provide the historical high, low or daily series needed to reproduce either IV Rank or IV Percentile. Without that denominator, the number is untraceable, however plausible it looks.
Where it falls short (the right answer): Pull the current IV and the named historical measure from your broker or another dated source. Paste the figures with the share price and date. Ask the model to explain them, while retaining the source’s definition.
Specific strike recommendations without chain data
The question: “Which price should I sell BMNR at this month?” This is the question most likely to cost an ordinary trader real money if they take the answer at face value.
Why it earns its place: Choosing the price to sell at is the most important call a covered-call seller makes. Too low and the shares can be taken off you below the price you wanted; too high and the payment may not justify the money tied up. A specific contract recommendation without a live chain omits the market information needed to compare the choices.
The Gemini prices hang together: the strike nearer the share price pays more than the one further away, just as the textbook says. They pass a quick glance. But the preserved session offers no timestamped chain against which to verify them. Plausibility is not provenance.
The right way round is the reverse. Pull two or three candidate prices from your broker. Paste them in with the relevant details. Ask the model to weigh up your shortlist against what you’re trying to do. The model judging numbers you brought is useful. The model inventing the numbers to judge is not. Prompt 3 of the covered calls post is the working version of the right approach.
Where it falls short (the right answer): Treat any specific contract quoted without a traceable live source as unverified. Make the model weigh up your timestamped shortlist instead.
Earnings dates: verify the source and status
The question: Does the company report results during my trade? The expected swing balloons before results and collapses after. Getting caught holding a call through an announcement you forgot about is one of the most common ways sellers get burned.
Why it earns its place: Search can surface calendar pages quickly, but an estimated date and a company-confirmed date are not the same thing. Companies can move reporting dates, and third-party calendars can lag or infer them.
I ran this on 2026-05-16, the exact prompt, no date context given, to ChatGPT with web search on:
“Probably not. The available earnings calendars show BMNR last reported earnings on April 14–15, 2026, for the quarter ended February 28, 2026. [MarketBeat +2]
Q1 FY2026 → reported January 2026 Q2 FY2026 → reported April 14–15, 2026 Next likely report (Q3 FY2026, quarter ending May 31) would most likely land in July 2026, not before June 20.”
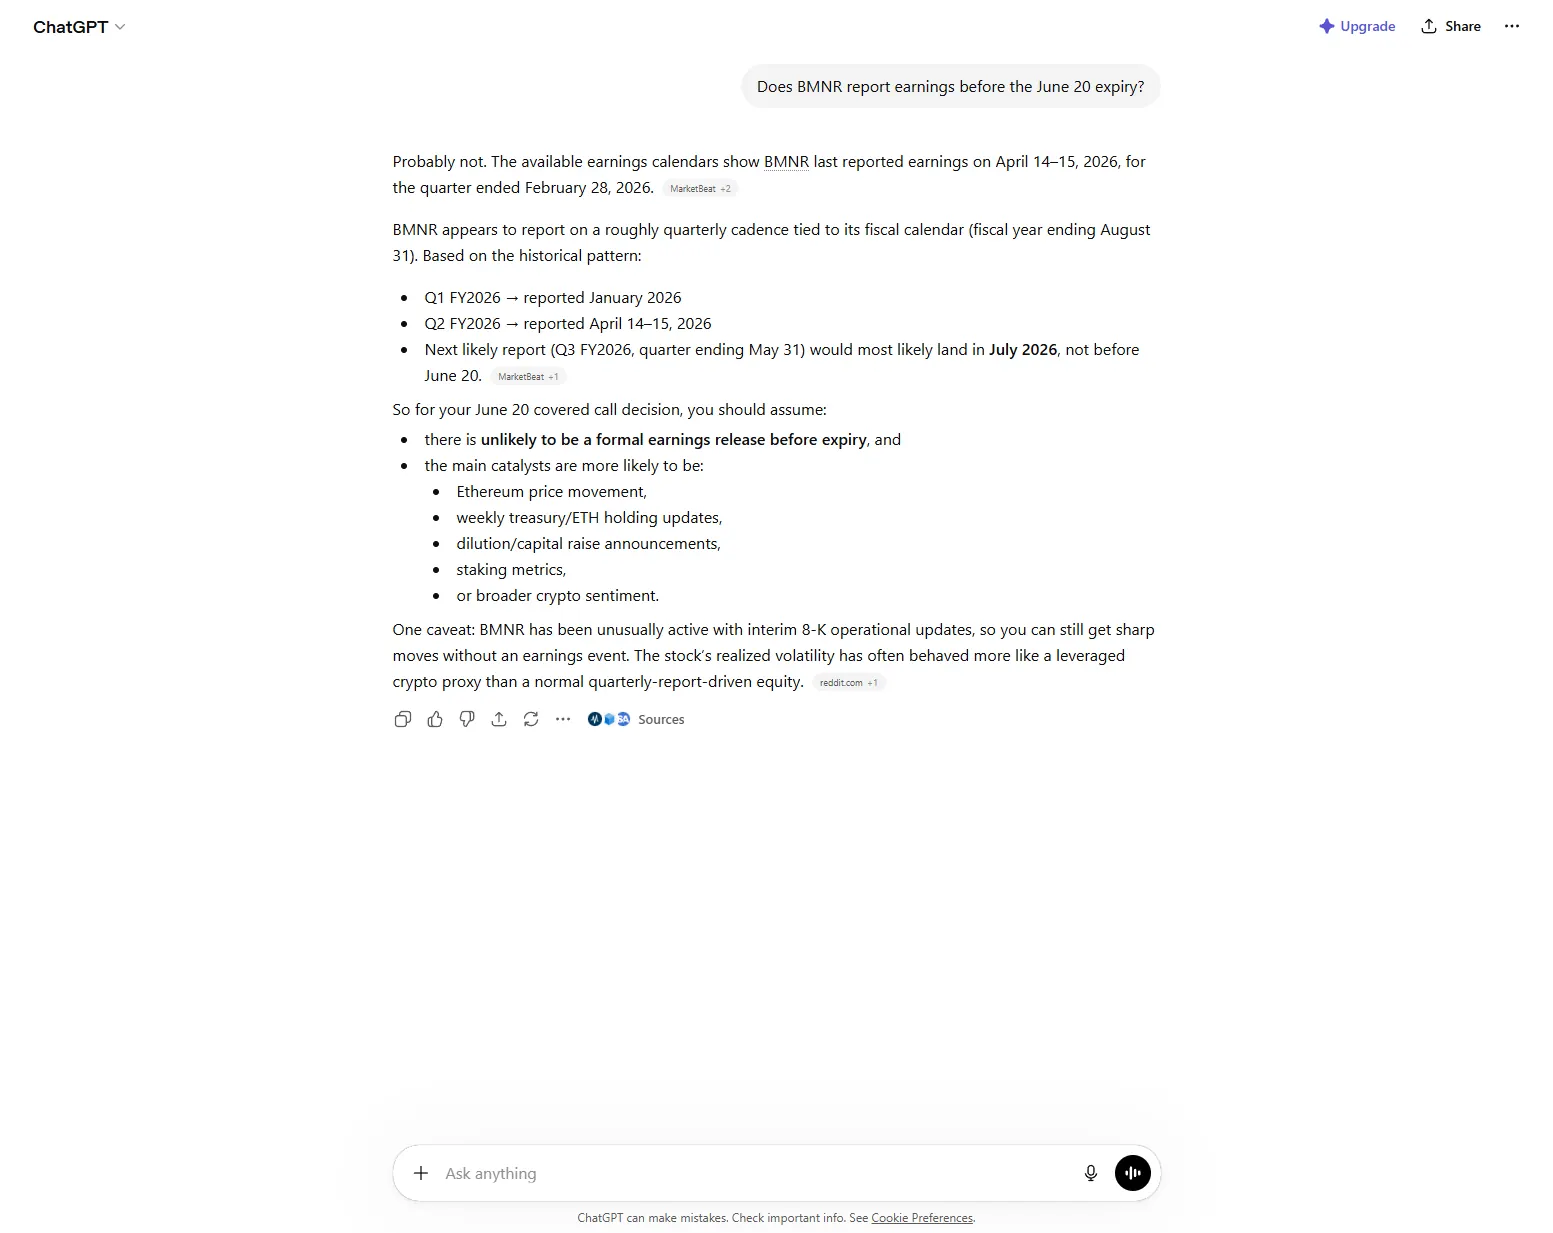
This answer is not a proved error. It says “probably not” and “most likely”, and the preserved response also mentioned interim 8-K updates. It is a useful searched lead, but the status of each cited date still matters: estimated, scheduled or company-confirmed.
I treat any specific date the model gives me as something to check, not a fact. The event-window prompt is built around that: it produces the list of things I should look up, results dates among them. AI is good at the list. Confirming each one is a job for the broker or the company’s own page.
Where it falls short (the right answer): Check the company’s investor-relations page or filing first, then a reputable calendar or broker. Use AI to assemble the checks and surface sources, not to turn an estimate into a confirmed date.
Black-Scholes calculations on hypothetical inputs
The question: “If the stock’s at $21.77, the payment is $1.50 and there are 28 days left, what’s the fair value of this option?” This is the kind of question that sounds technical enough to deserve a precise answer.
Why it earns its place: Black-Scholes produces a theoretical value from a model and a set of inputs: spot price, strike, time, rate, dividends and volatility. An AI can explain the formula or help inspect code, but the output is only as sound as the implementation and every supplied input. I have not tested AI-written pricing code against my broker’s calculator, so I do not claim a measured failure rate here.
A theoretical value can still be useful for sensitivity work, but it is not a live executable price. State the day-count convention and every other assumption, and compare the result with a broker or validated calculator before relying on it.
Where it falls short (the right answer): For anything you’ll trade on, use a verified calculator and the live contract data. Use AI to explain the result or test assumptions, not to hide them.
Assignment probability without live delta
The question: “What are the chances my BMNR $23 call gets called away before June 20?”
Why it earns its place: Delta is primarily the theoretical change in option price for a one-unit move in the underlying. Traders sometimes use its absolute value as a rough proxy for the chance an option expires in the money. That is not the same as the probability of assignment. American-style equity options can be exercised before expiry, and assignment also depends on moneyness, remaining time value, expiry and events such as dividends.
The dated Claude receipt below asked for the odds without supplying a live chain. Claude searched for a share price, estimated volatility from web references, named its method and returned ranges. That transparency matters, but it does not make the inputs suitable for a trade decision.
The 2026-05-16 test on Claude.ai (Opus 4.7, Max plan, web search enabled) is typical. It searched for BMNR’s price, guessed the volatility from old references, and ran its own sum:
“Plugging that into a Black-Scholes-style N(d2) calc with σ ≈ 90–110% gives a risk-neutral probability of finishing above $23 of roughly 30–40%. If you want the probability it just touches $23 at any point before expiration… call it 55–70%.”
The 90–110% volatility range came from web references, not the live contract. Claude disclosed the estimate and told Ben to check the broker.
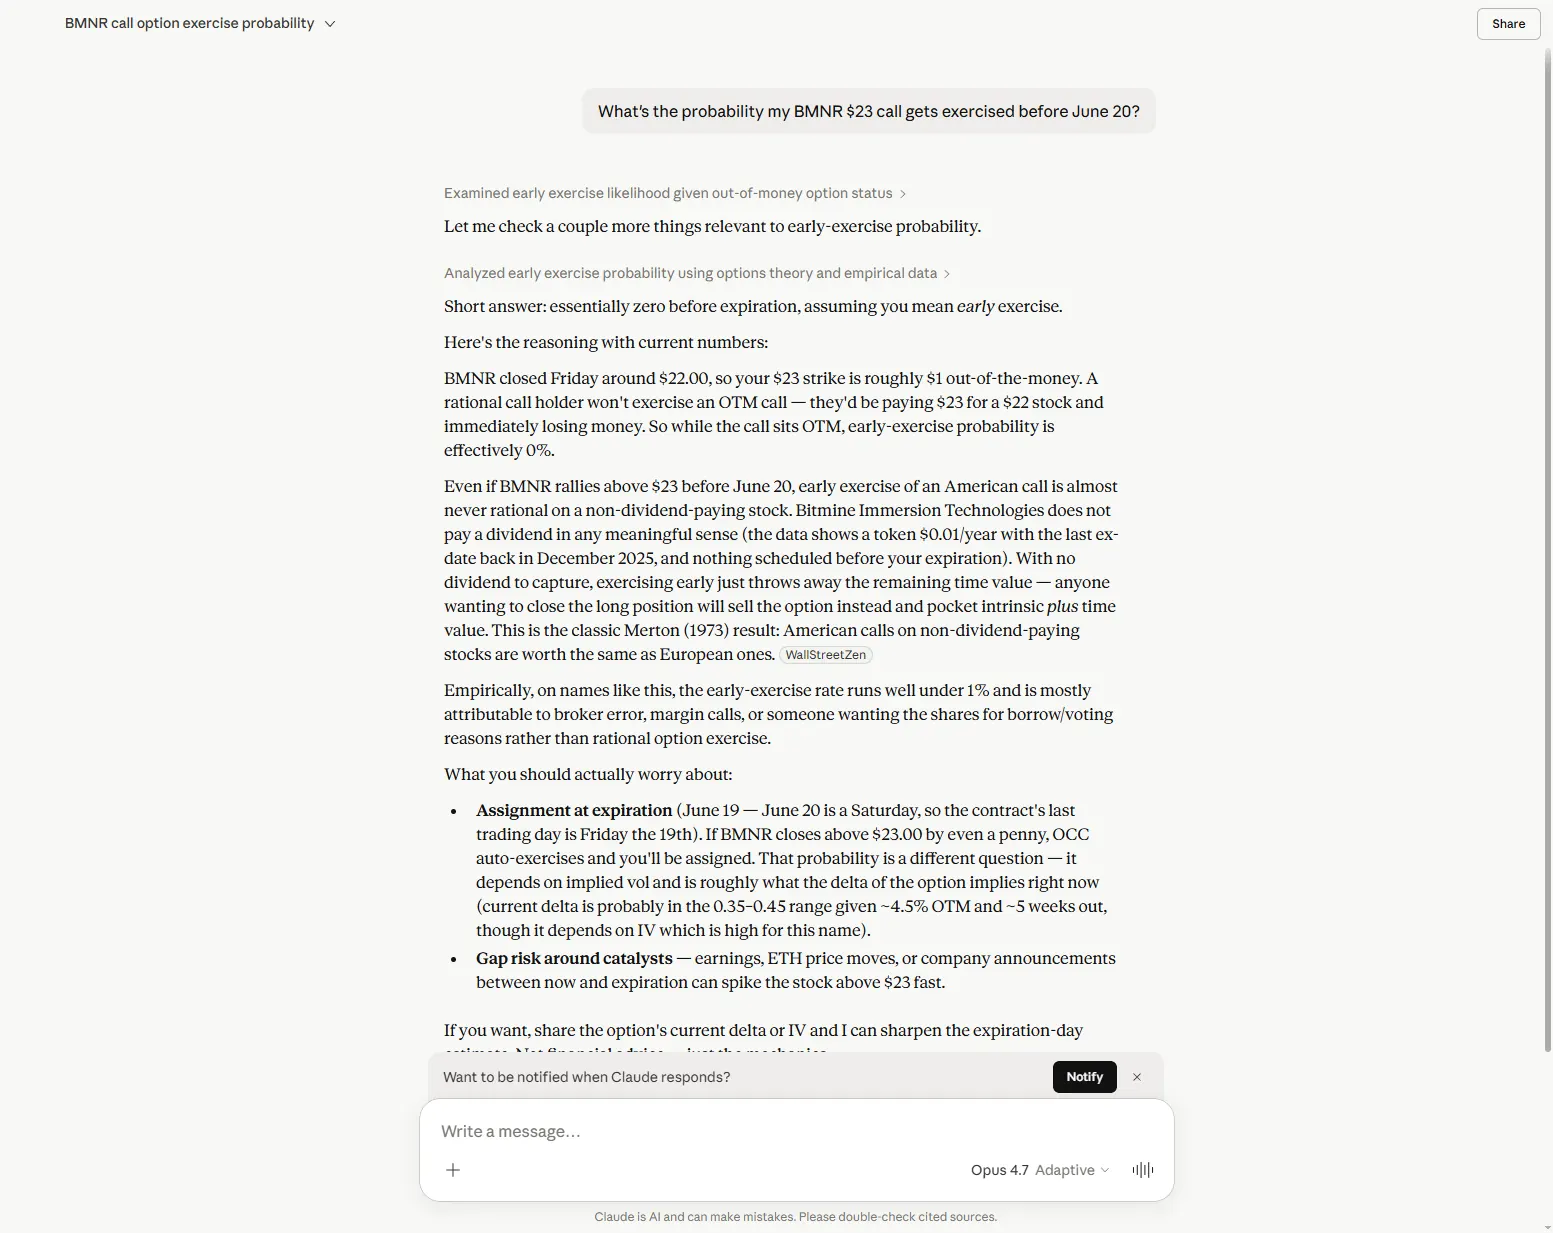
The volatility range of 90–110% came from older references found by web search. Claude explicitly called it a rough estimate, returned ranges and suggested checking the broker. The calculation is reproducible only as an estimate from those assumptions; a different volatility input can move the result materially.
The practical problem is narrower: the estimate answers a modelled probability of finishing above the strike, not the literal chance of assignment before expiry. For position management, check the live contract and the factors that affect early exercise rather than translating one model output into a certainty it does not represent.
Where it falls short (the right answer): Use the live chain and broker tools for the trade. Ask AI to explain delta, time value and scenario assumptions, while keeping expiring in the money and being assigned as different questions.
Where AI for options trading helps, and where to stop
The split is simple enough to hold in your head.
| Part of the trade | AI useful? | When to put it down |
|---|---|---|
| Sense-checking the idea | Useful with your context | When factual premises are unsourced |
| Reading the volatility figure you paste in | Useful | When the measure or historical series is unclear |
| Weighing up your shortlist of sell prices | Useful | When the contracts are not live and timestamped |
| Listing what to look out for | Yes | The moment it names a specific date, check it |
| Reshuffle, close, or hand over the shares | Yes, choices against your goal | When you need a live price |
| Live prices and volatility figures | Only with a verified connection | When source, timestamp or contract is missing |
| Pricing an option from scratch | Useful for scenarios | When implementation or inputs are hidden |
| Odds of getting called away | Useful for explaining factors | When delta or N(d2) is treated as literal assignment probability |
The pattern: AI can be a useful second opinion when the data route and assumptions are visible. The Prompt Stack is what holds the line, the FILTER stage especially, where you paste the verified data, use a deliberate connection, or mark the number as unknown.
The short version
What worked: Thinking jobs against data you bring: sense-checking the idea, naming your intent, working through the choices and reading supplied figures. These are the four workflows in my routine, not four scored test wins.
What needs a guardrail: Current prices, volatility measures, exact contracts, event dates, modelled values and assignment questions. Verify the source and status instead of treating a current-looking answer as current data.
Bottom line: In the dated Gemini receipt, an unconnected chat supplied current-looking figures under an unsupported “current order book data” claim. That is enough reason to stop and verify; it is not evidence that every number was false or that Gemini behaves that way every time.
The one rule that makes AI safer for options trading fits in a sentence: verify the source, timestamp, exact contract and assumptions behind every decision-affecting number. Every useful prompt in the covered-call routine either hands the model the data, uses a deliberate connection, or tells it plainly to leave the number unknown. Two companion posts show how: 7 AI prompts for covered calls maps the entry-side prompts to seven decision moments, and AI covered calls: when NOT to sell another one handles the check before you sell another one once a trade has closed. And for the exit itself, the decision to sell the shares rather than the call, the prompt I run before any sell applies the same write-it-down-first discipline. Read them next.
The dated Gemini provenance failure and Perplexity’s unstable option-chain responses are logged at The Lessons, alongside other slips caught on this site. The hedged ChatGPT calendar answer is not logged as a proved error, and Claude’s estimate remains a disclosed-assumptions lesson rather than a fake calculation. The wider patterns are mapped in the nine named failure modes.

Ben tests how far you can trust the main AI assistants, and publishes exactly where they get things wrong. Every post here is a first-hand test with the receipts, including the times a tool simply wasn’t worth the trust. About Ben →
The site tests how far you can trust the main AI assistants, on real decisions. Start with the Prompt Stack for the four-stage framework, free and ungated, or the Bluff Filter for the paste-ready version with a real before and after.